documentation
Process improvement view
You can access this view by clicking on this icon:

In this tab you can simulate process improvements based on changes in activities and arcs over current process executions.
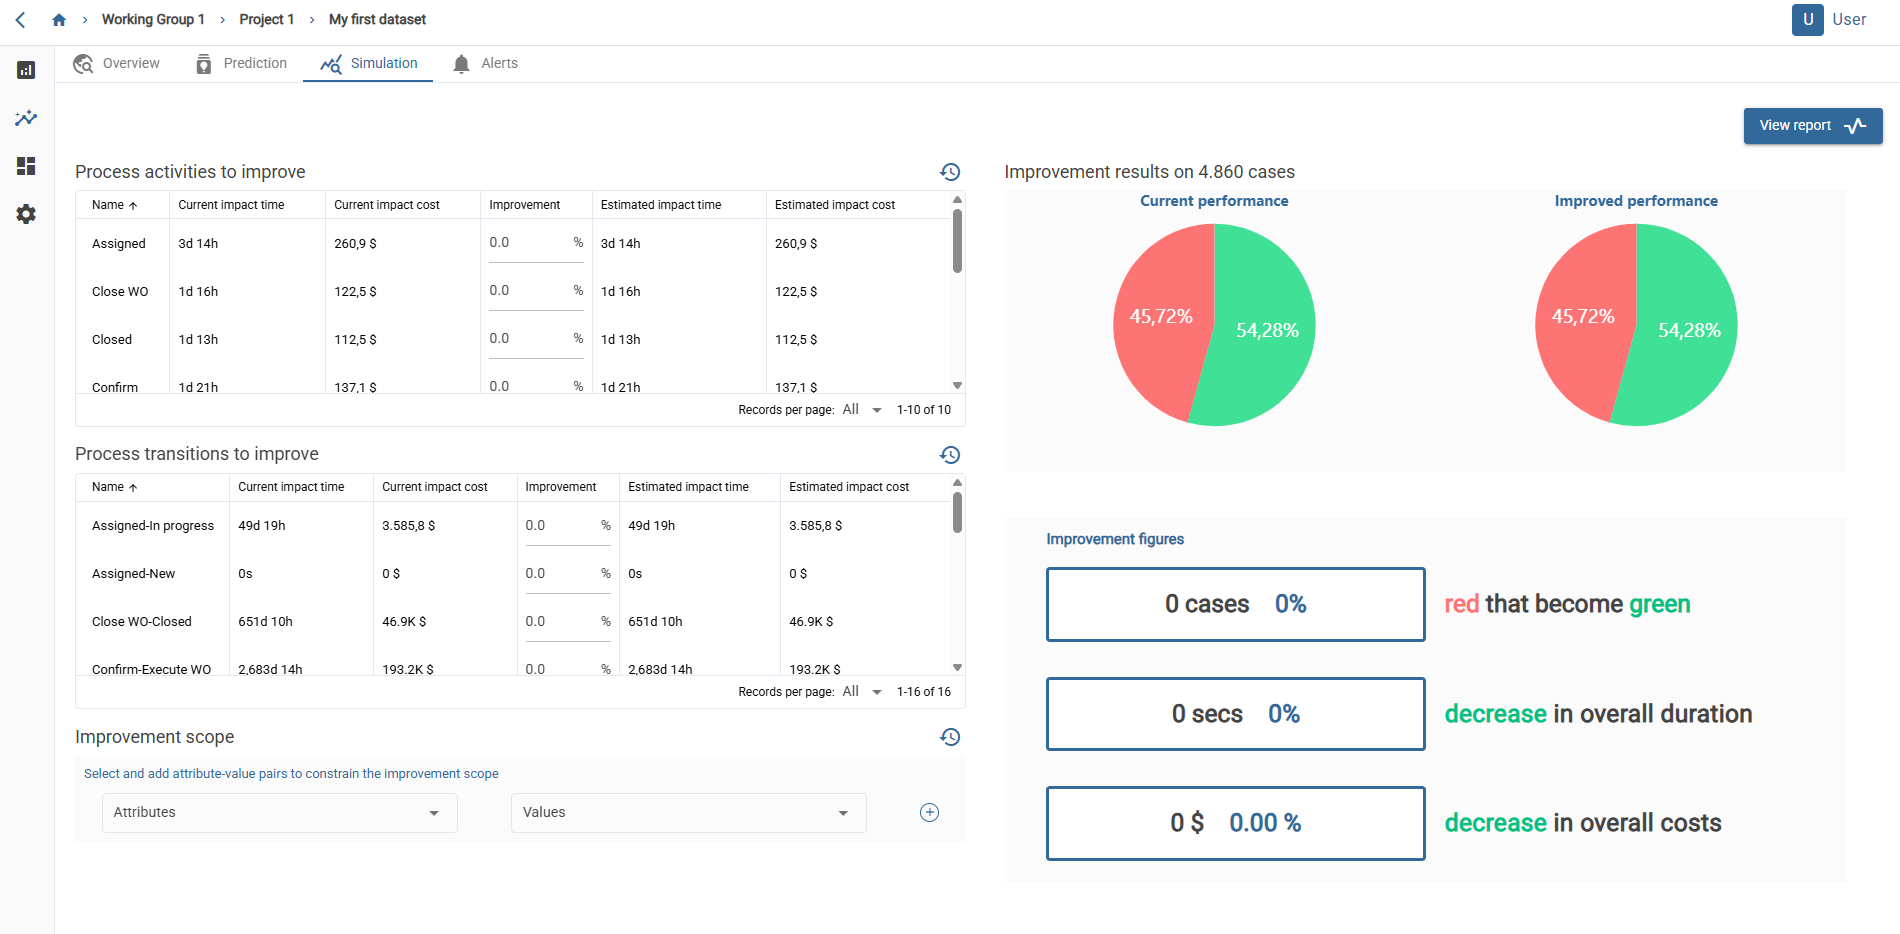
On the left half of the view we find two tables.
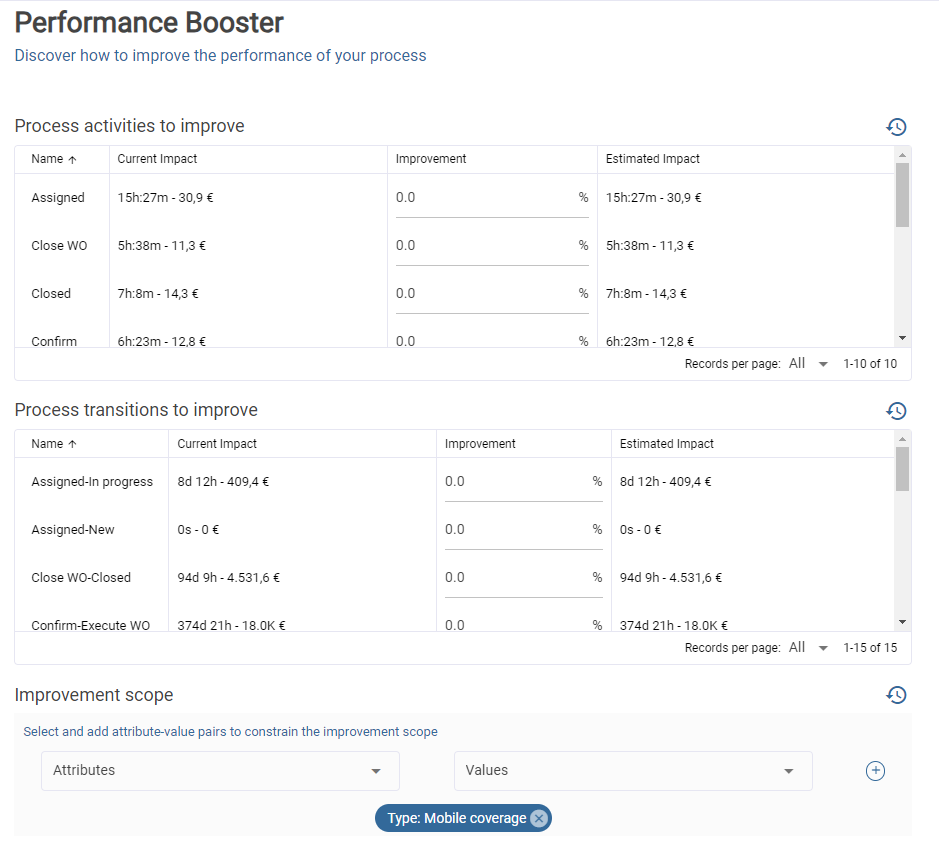
The first contains a list of the process activities, including the name of the activity, its current total impact (i.e. total duration of the activity in the process and hourly cost if defined) and its estimated impact, which can be modified for the simulation. The second contains exactly the same, but with the process transitions. Finally, below we find a panel called “Improvement scope”, which allows adding attribute-value pair combinations, which will make the improvement percentages apply only to the cases that meet that filter.
These three elements are resettable by clicking on the reset icon

The tables can be sorted by columns by clicking on each corresponding column (alternating between ascending and descending). By default they will be sorted by activity/transition name.
On the right half we find two sections with data that varies depending on the data we have entered in the previous elements.
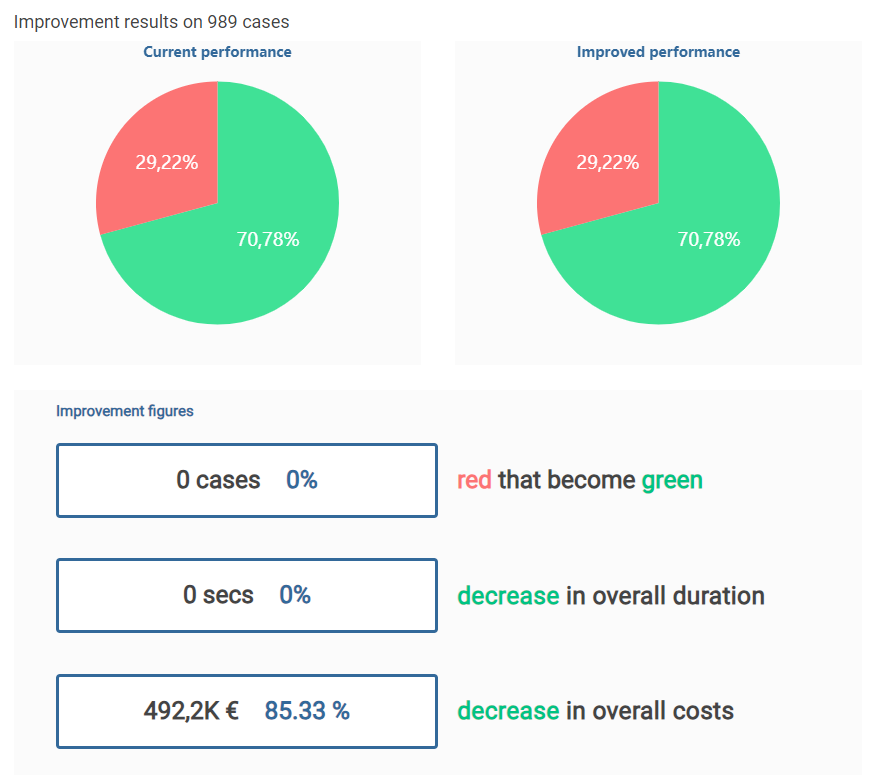
The first contains two pie charts that show the % of cases below and above the target duration, one of them without applying the improvements in the tables, and another of them applying the improvements in the tables. The title shows the number of cases on which the improvement is being applied. The second is a series of metrics, which include: The number and % of cases above the target duration that turn below with the improvement The absolute value and % of the total time reduction with the improvements The absolute value and % of the total cost reduction with the improvements