documentation
Prediction
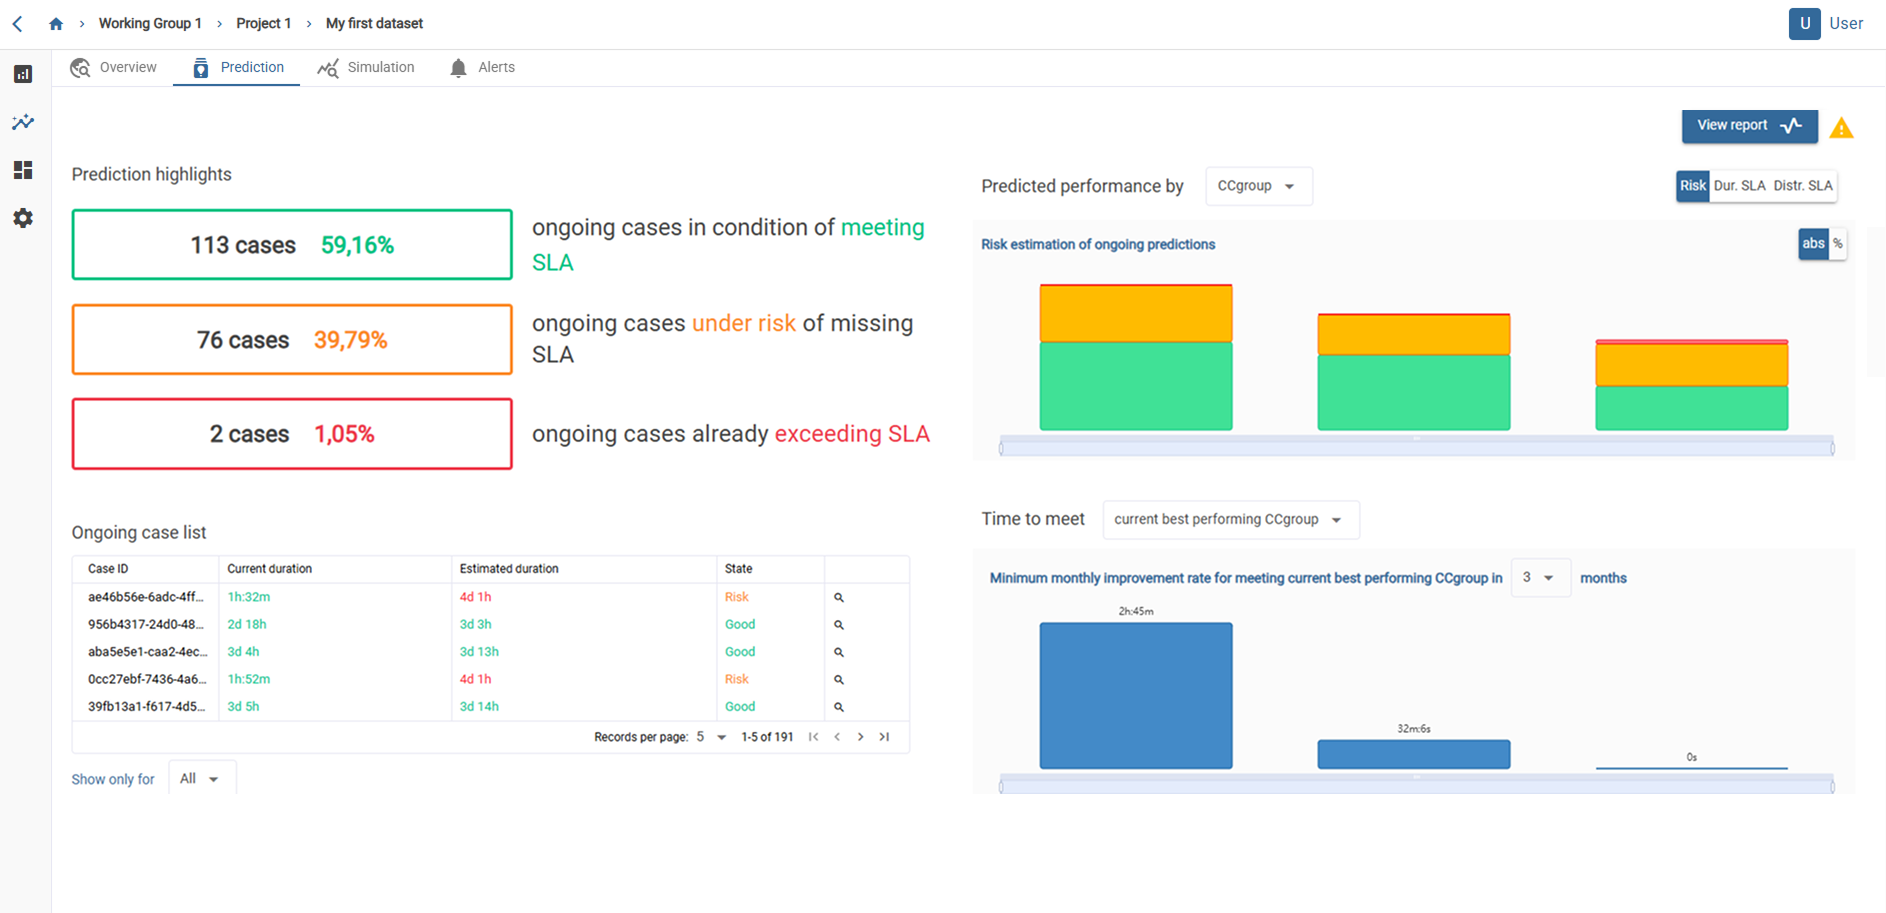
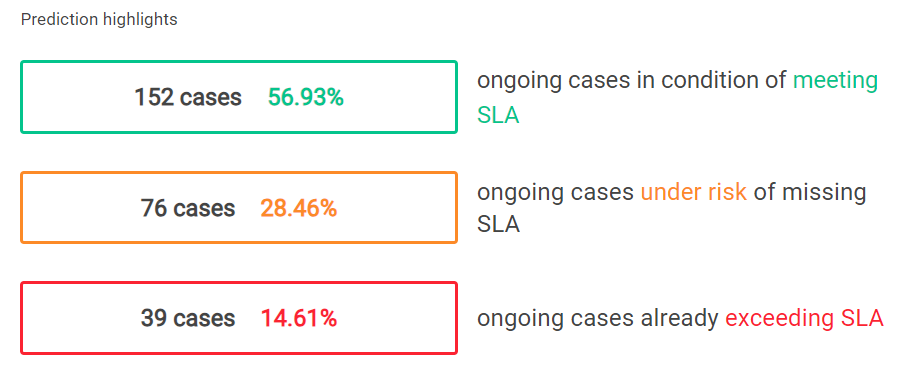
Prediction highlights
In the upper left section, you can observe an estimation for cases currently in execution, indicating their status regarding target duration compliance:
- Cases at risk of non-compliance with the target duration are highlighted in yellow.
- Cases not at risk of non-compliance with the target duration are displayed in green.
- Cases that have already exceeded the target duration are marked in red.
Ongoing case list
At the bottom left, a table provides a comprehensive overview of ongoing runs along with their associated predictions. This table includes the following details:
- Case ID
- Current case duration, displayed in green if below the target duration and red if above the target duration
- Estimated case duration, depicted in green if below the target duration and red if above the target duration
- Case status based on its current duration and prediction: displayed in green for cases without risk, orange for cases with risk, and red for cases exceeding the target duration.
Moreover, the table features filtering functionality by a value-attribute pair. Each row in the table is equipped with an icon on the right, enabling users to navigate directly to the tracking viewer filtered by the corresponding case ID.
Predicted Performance
In the upper right section, a breakdown of risk by attributes is presented, featuring three distinct graphs. Users have the option to choose the attribute by which to group the data, and a button facilitates switching between the following graphs:
-
Risk Estimation of Ongoing Predictions: This graph illustrates, for each value of the selected attribute, the number of cases falling under each of the three risk levels. These levels are represented by stacked bars: red for cases above the target duration, yellow for cases at risk of non-compliance with the target duration, and green for cases below the target duration. Users can toggle between absolute and percentage representations.
- Predicted Duration VS Past Duration: Here, the average duration of completed past cases and ongoing cases is displayed for each value of the selected attribute. If the values are above the target duration, the bars will be shown in red; otherwise, they will appear in green. Users can select the time range of past cases to compare, with options including 3, 6, 9, and 12 months.
- Performance of Past Cases VS Ongoing Predictions: This graph showcases, for each value of the selected attribute, the number of cases above and below the target duration for both completed past cases and ongoing cases based on their estimated duration. Users can switch between absolute and percentage representations and select the time range of previous cases to compare, with options including 3, 6, 9, and 12 months.
Time to meet
The graph on the right displays the various attribute values and the time required for monthly decreases to attain the value defined in the selector within the chosen timeframe (3, 6, 9, or 12 months). Additionally, it offers customization options via a drop-down list, enabling users to select either the “current best performance attribute” (aligned with the choice in the “Expected performance” component filter) or “target duration”.
Exception: prediction no available
Sometimes, it may not be possible to make predictions on running cases because there are no previous existing variants. An ornage message, as shown below, will be displayed:

If there are no cases that receive a true prediction (all correspond to the new variant), an error will be returned indicating that there is not enough historical data to provide a prediction.
If the percentage of cases is mixed, that is, there are cases that are predicted and others that are not, only the cases with a prediction will be shown and a warning will be included to inform that the prediction is not for all the data.