documentation
Process Overview
 You can access this view by clicking on this icon.
Provides information on target duration compliance, distinguishing between cases that fall within the target duration (in green) and those that are above the target duration (in red). This information is shown both in number of cases and in percentage.
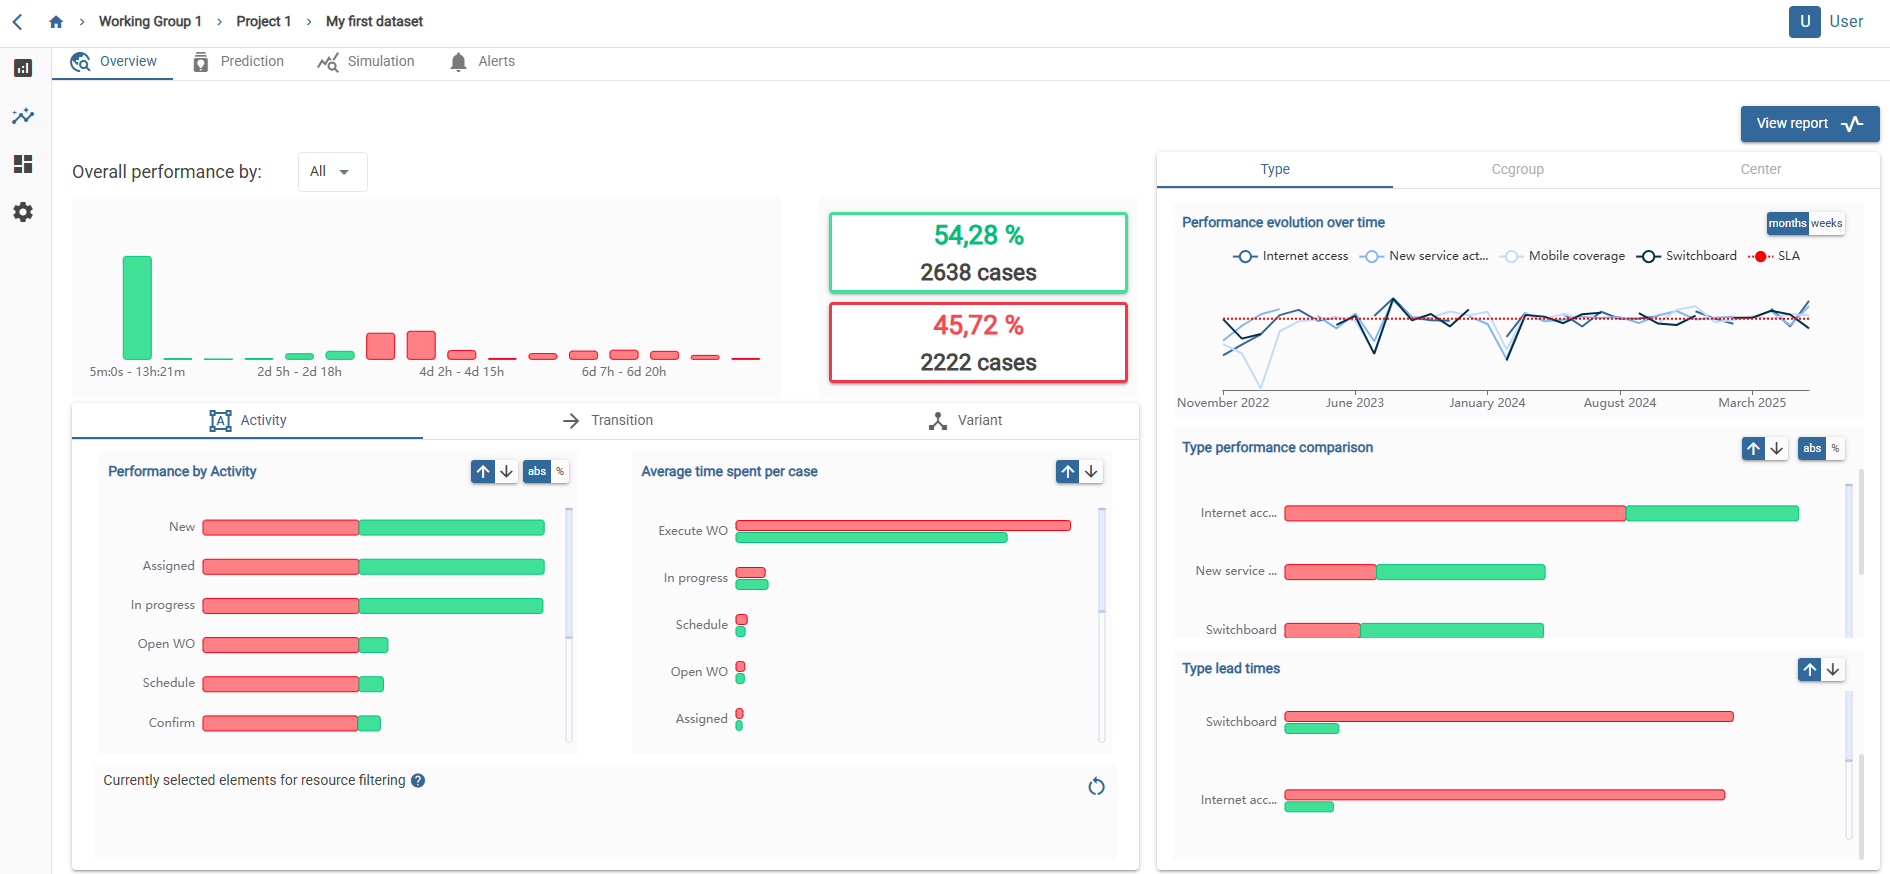
You can filter the information by activities, arcs, or variants. The left-hand graph displays the total number of cases per activity/transition/variant that meet and do not meet the target duration. Meanwhile, the right-hand graph illustrates the average duration per activity/transition/variant and their target duration compliance status.
On the right, a breakdown by relevant attributes is presented. The first graph depicts performance over time, segmented by the attribute values. This can be adjusted by month or week. The subsequent graph showcases the number/percentage of cases falling within and exceeding the target duration, categorized by the attribute’s values. Additionally, average case times above and below the target duration are displayed, segmented by attribute values.
Above the graphs, various icons offer options to customize data visualization:
- Ordering from greatest to least number of cases and vice versa.
- Choosing between displaying the percentage or the total number of cases meeting and not meeting the target duration.