documentation
Analysis Tab: Traces
In the traceviewer tab you can see the data model as it has been uploaded to the platform.
In blue you can see those key fields for mining and in green all the attributes that enrich the analysis.
The number of events corresponds to the total of activities contained among all the executions of the process. The number of cases corresponds to the total of executions.
In the box located at the top right you can filter by the desired trace ID.
At the button we can see the number of rows displayed per page (30 by default). This value can be modified with the dropdown.
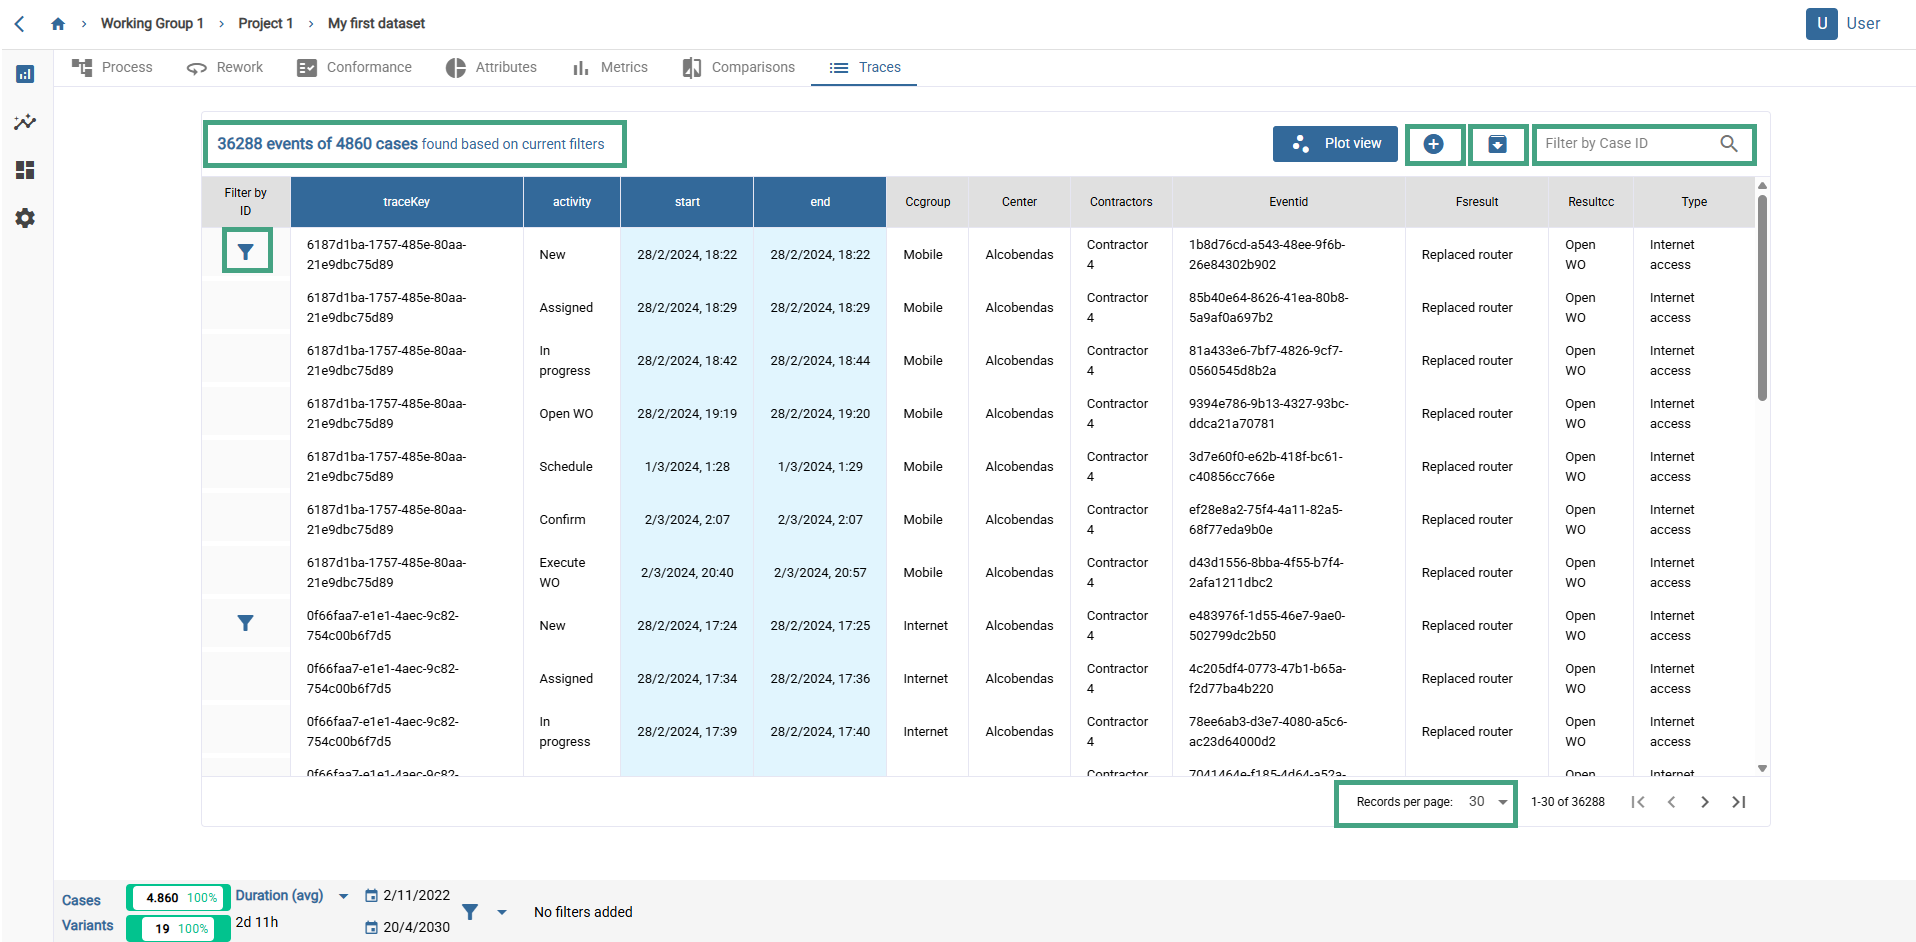
 It is possible to download the data set by clicking on the button in the blue box with the arrow boxed in green in the image.
 It is possible to create a new data set from an existing one. The new data set will appear inside the project.
 Clicking on the filter icon in the left column filters the table and also applies the filter globally.
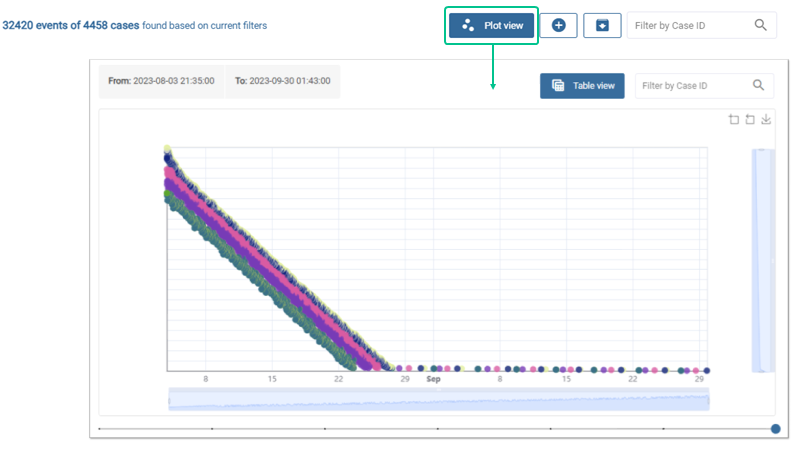
Plot view
It is possible to view a graphical representation of the data by clicking on the “Graphical View” button boxed in green on the image.
In this view you can see the different activities ordered on the Y axis by their trace IDs and on the X axis by the start date.
By placing the cursor you can view these values in detail.
It is possible to vary the ranges of both axes if desired.