documentation
Analysis Tab: Conformance
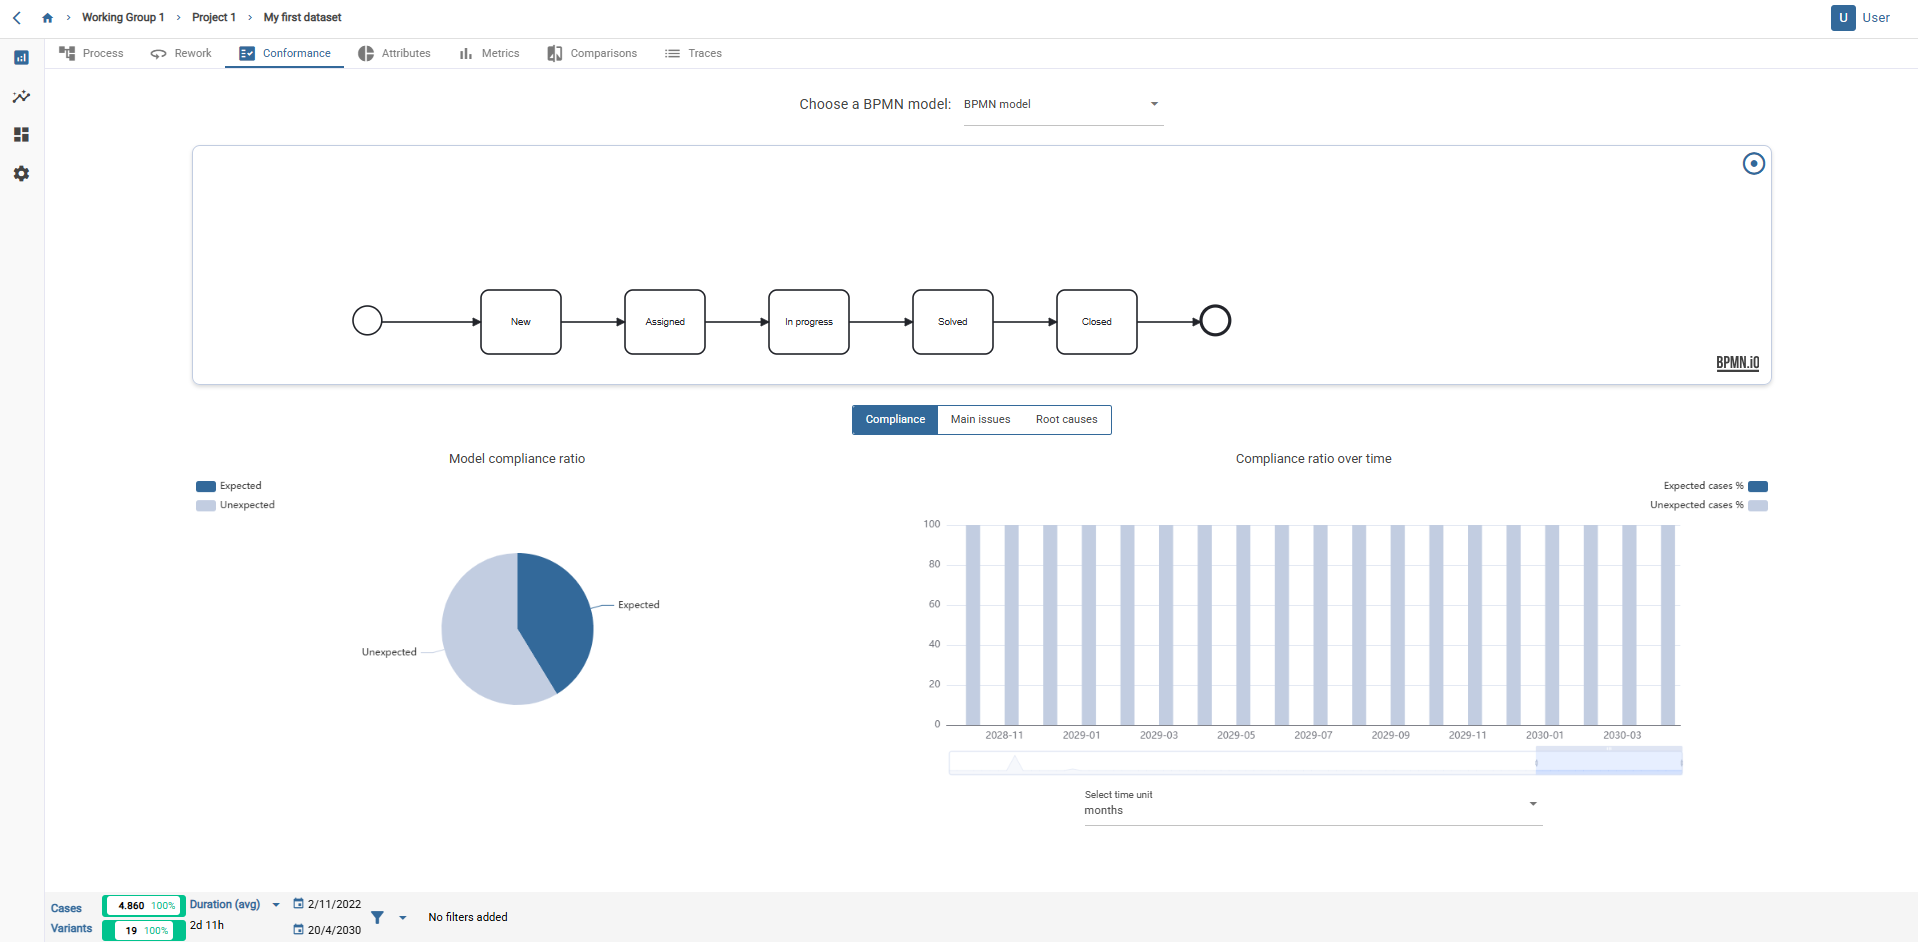
Wide view of the tab
In the live conformance tab you can compare the selected BPMN model with the uploaded data to check if they comply with the sequence of activities, as well as other metrics.
You can select the BPMN model to perform the compliance comparison in different ways: you can import a BPMN as described in the “Data - Models” section of this manual, or you can save one of the tool’s visualisations as a BPMN as explained below.
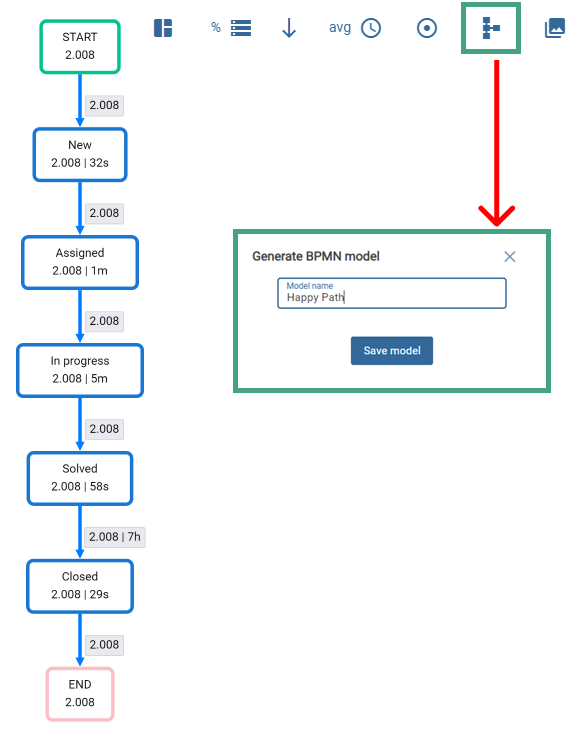
Live conformance tab.
To save the network being viewed as a BPMN model, simply click on the button at the top right, as shown in the image.
This can be done from the tabs “Model”, “Variants” and “Loops”.
A pop-up window will then appear. You can name the model there.
The BPMN model will be saved in the models tab of the project itself from where it has been generated.
The compliance tab consists of 3 tabs: “Compliance”, “Main issues” and “Root causes”.
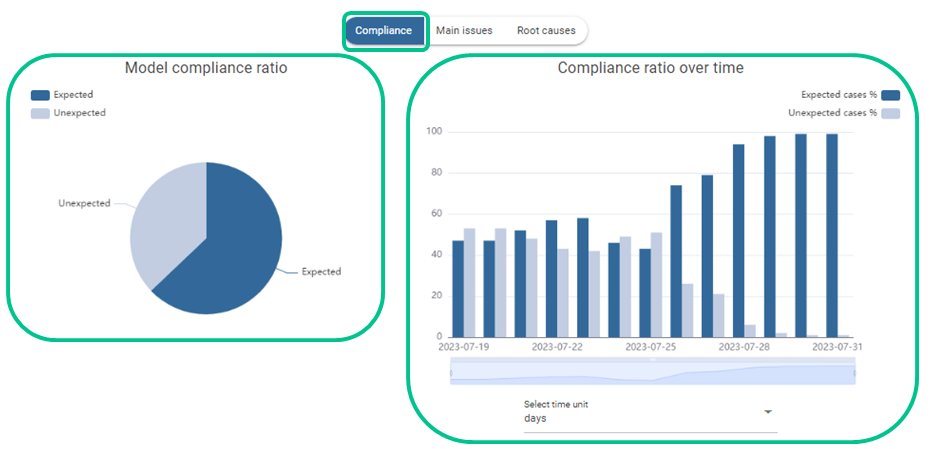
Compliance
In the “Compliance” tab, there are two graphs:
- “Proportion of model compliance” graph: you find the percentage of traces that match your compliance model.
- “Compliance ratio over time” graph: it gives a temporal view of how many traces comply with your conformance model over time. The time scale can be modified to facilitate analysis and visualisation.
Main issues
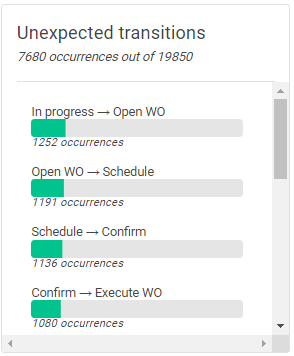
In the “Main issues” tab there are three graphs:
- “Unexpected transitions” graph: it shows the transitions between activities not covered in the compliance model that have been found in the data model.
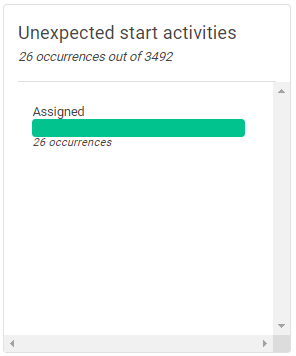
- “Unexpected start activities” graph: it shows which activities (other than the one in the compliance model) appear as the first activity.
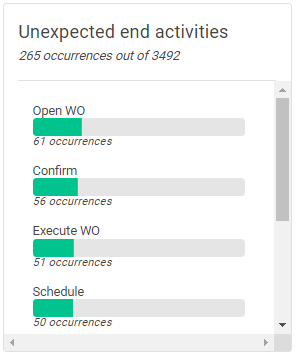
- “Unexpected end activities” graph: analogous to the Unexpected start activities” graph, but with the comparison with the last activity of the conformance mode.
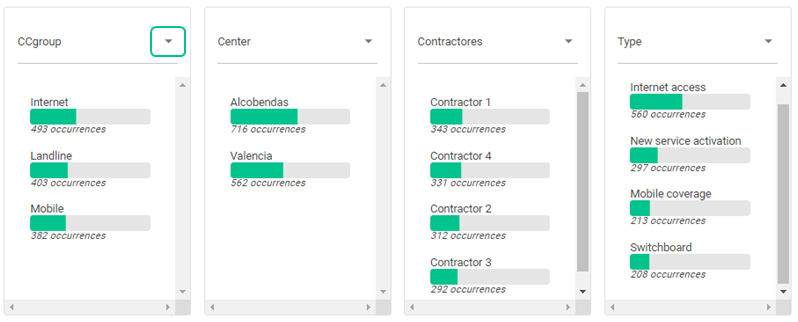
Root causes
In the “Root causes” tab you find four graphs that contain information about the attributes of your dataset:
In the graphs, you can select the desired attribute. You can see simultaneously up to 4 attributes.
This tab allows you to see which values of the selected attributes cause the occurrence of the non-conformity of the selected BPMN model with the rest of the data.
When you have selected relevant attributes these are shown as the first values.