documentation
Analysis Tab: Rework
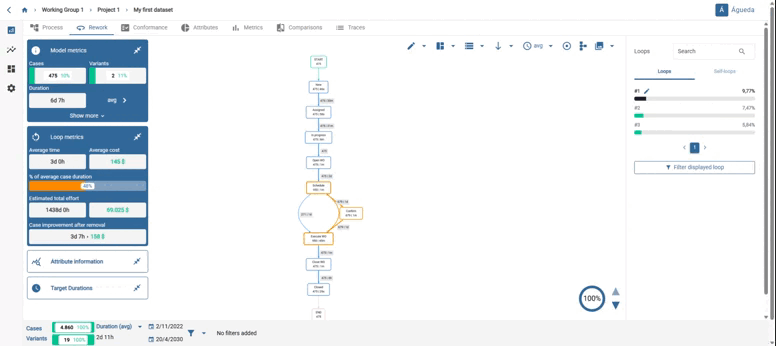
In the rework tab, we can see the different loops present in the data. These are shown inside the graph highlighted in orange.
On the right side, you can see the “loops” or “repetitions”. The tool detects these loops present in the traces and sorts them by their frequency of occurrence. Each of these loops can belong to one or more variants.
On the left-hand side, in addition to the model metrics, the loop metrics contain the following information: the average duration and cost invested in the loop, the average percentage of the loop’s duration compared to the duration of the entire trace, and an estimate of the savings in time and money that would result if the loop were eliminated.
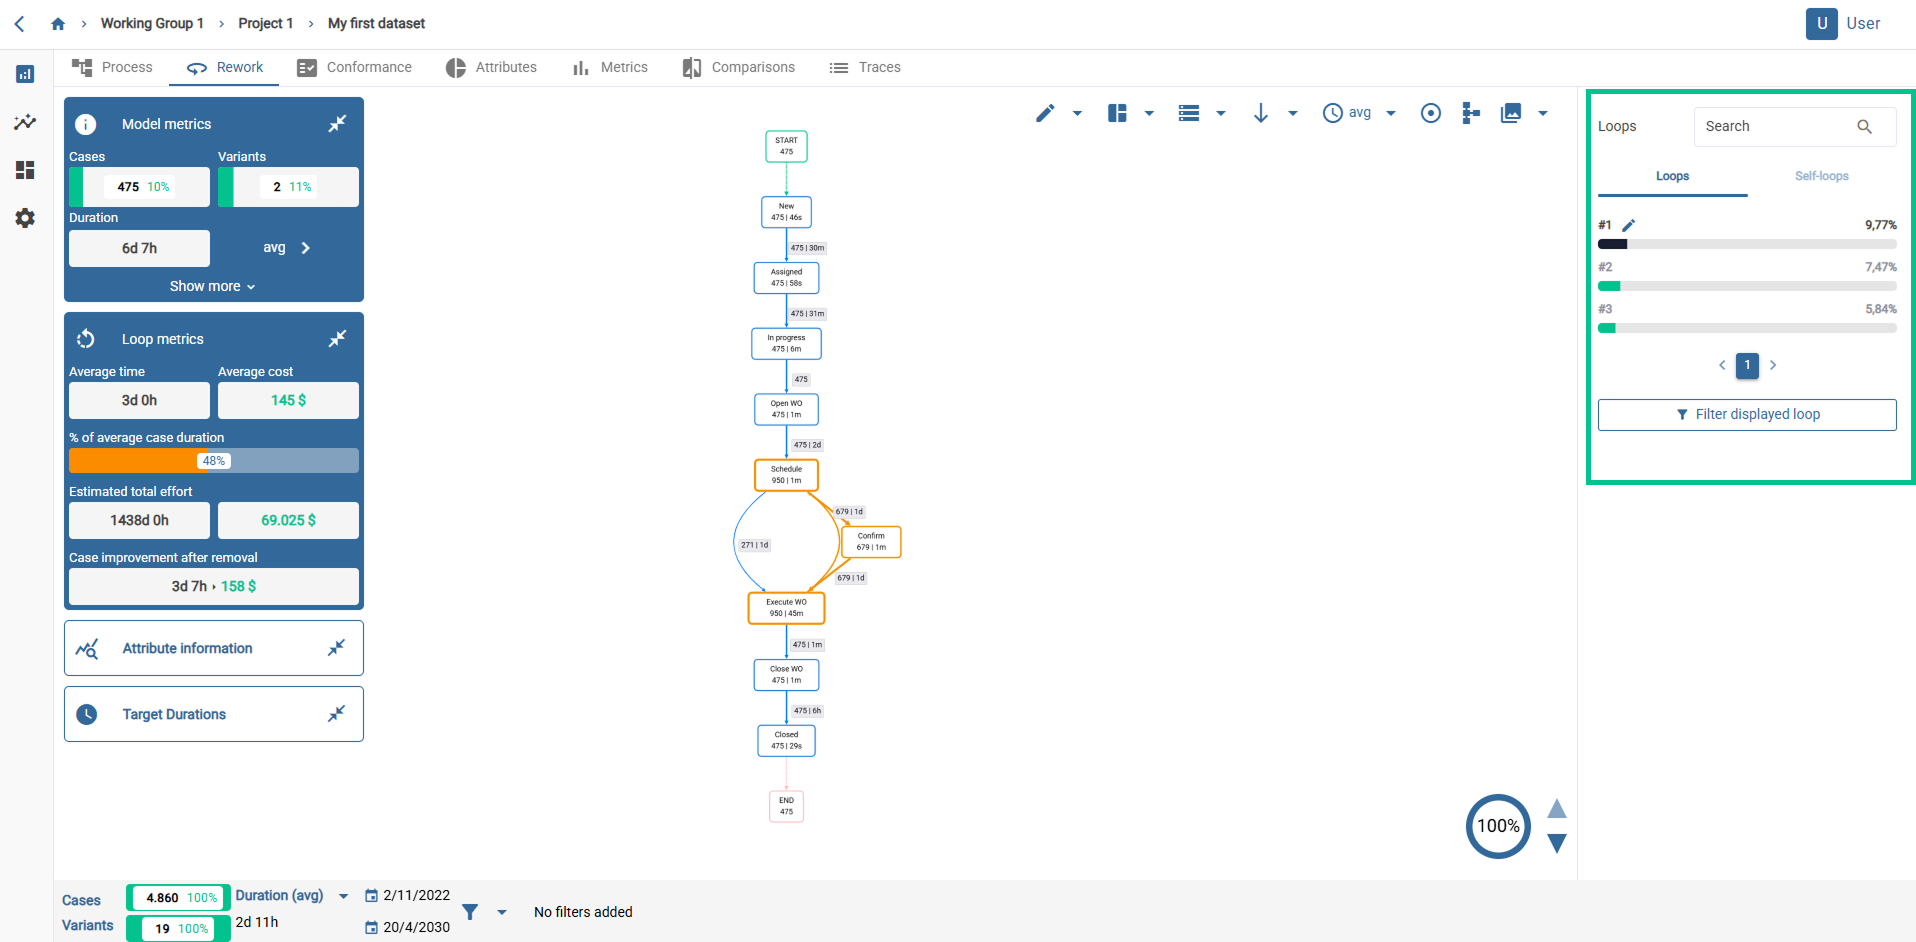
The loop metrics include economic estimates of loop times. These estimates are based on a price per hour. The price per hour can be modified clicking the button on the top right with a gear symbol. Like other common tabbed process panels, Loop Metrics can be dragged, minimized, and hidden completely via the icon  at the top of the graph.
In addition to loops, it is also possible to see repetitions, i.e. loops that occur when an activity is repeated several times in a row. This is called self-loops.
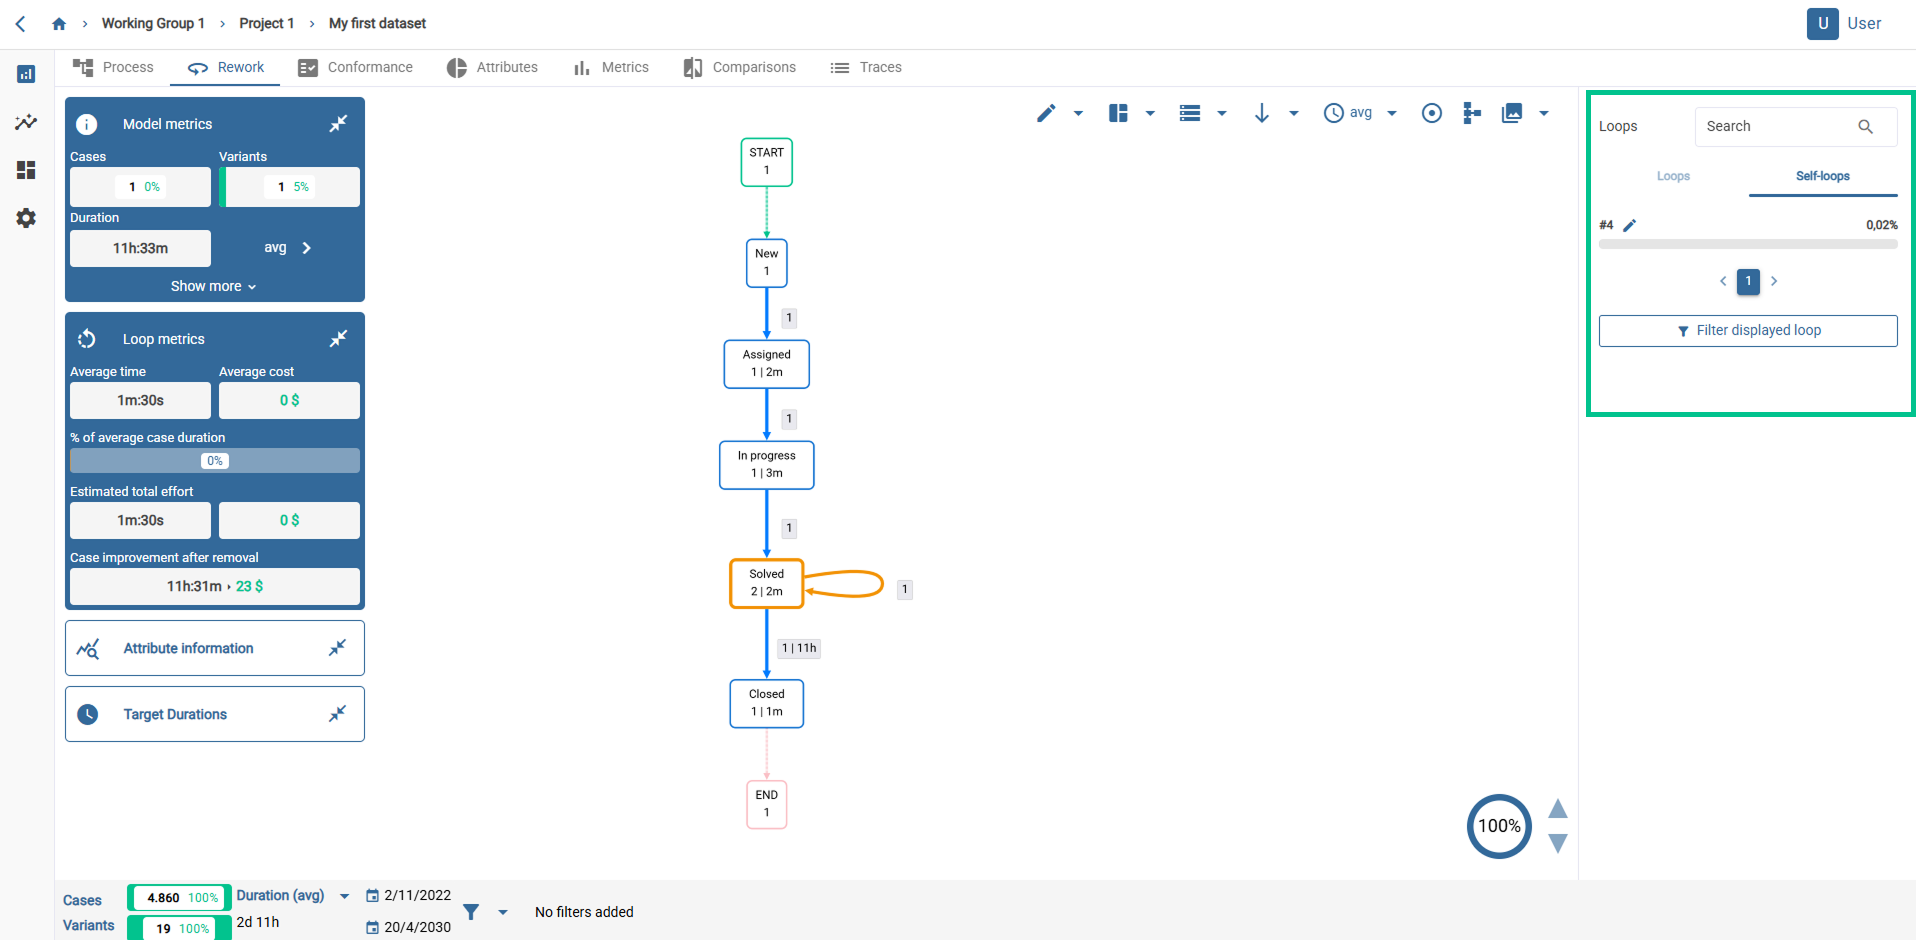
In order to carry out a more complete analysis, the tool allows you to add a filter with the specific loop you wish to study through the “Filter displayed loop” option.
You can move the activities by clicking on the box and scrolling to where you want to place it.
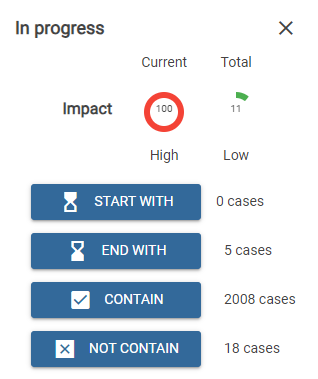
On the other hand, if you select an activity or an arc, a panel with information opens:
-Impact: shows the impact coefficient for current trace and for the total traces. This is calculated as follows.
P1= Deviation / average duration
P2 = Volume of the activity / Total volume (in how many traces it appears)
P3 = Duration of activity / total duration of the trace
Impact = P1xP2xP3
-Case count: here you can see, for the trace you are viewing, the number of times it starts with that activity, the number of times it ends with that activity and the number of times the traces contain or do not contain that activity or arc.
When we have a trace that has more than one possible path we can reduce the display of these paths by clicking on the icon in the lower right corner. By selecting on the arrows of this icon we will reduce the different paths in order to see the most frequent paths in a clearer way.
Exactly the same as in Process, if you want you can rename variants clicking on the pencil button.