documentation
Attributes
In the process attributes tab allows you to make a comparison of filtered data against non-filtered data.
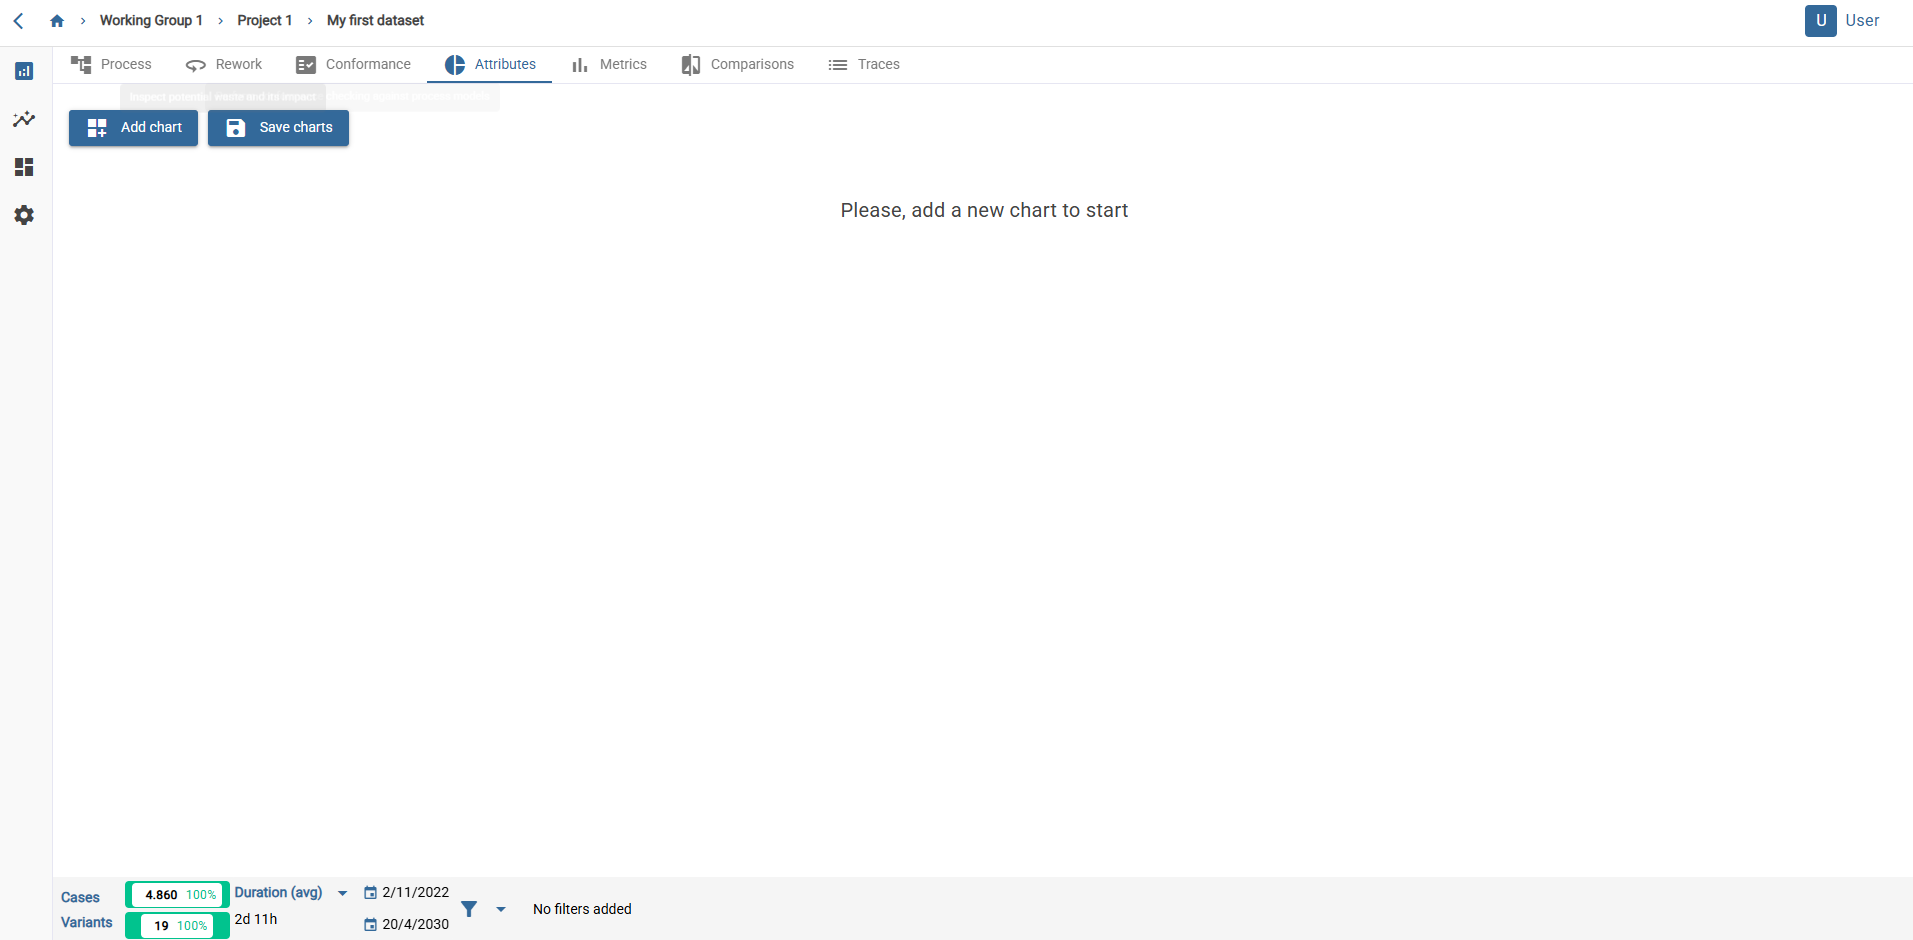
Once you have accessed the tab, it will be empty by default. So, first of all, you must add a comparison through the highlighted button (“Add Chart”).
Then an empty box will appear. You must select an attribute to view the graph. The following message will appear: “You have unsaved changes. If you leave this dataset, your changes will be lost.”
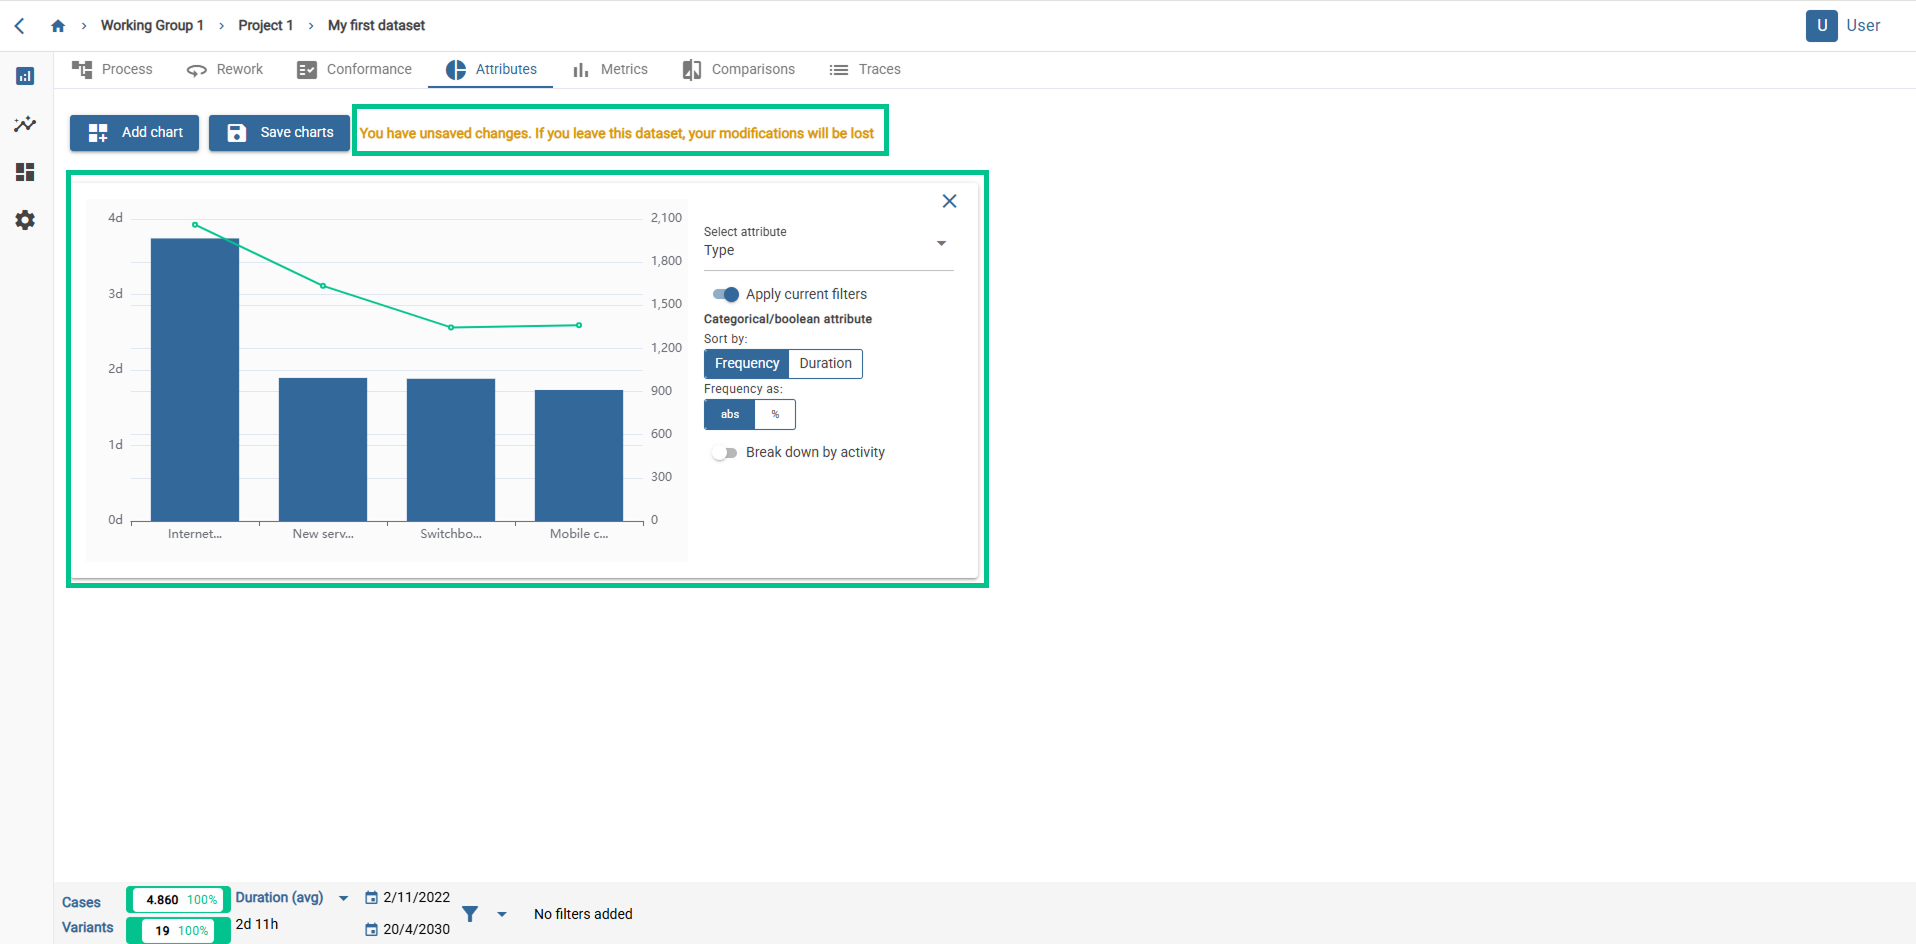
You can create up to 4 graphs by pressing the “Add chart” button. Once created, the next step will be to customize the created graphs, in order to display the desired comparison between attributes. In order to do that, you can: Select attribute: A drop-down menu will appear, with the attributes listed. You must choose one by simply clicking on it. Apply current filters: By clicking on the slider button, you can choose if you want to see the attributes of the already filtered data, or the attributes of the complete set of data. Sort by Frequency/Duration: By clicking on frequency, the data will be shown sorted by frequency. The same applies to duration. Break down by activity: By clicking on the slider button, a drop down menu will appear where you can choose the desired activity. You can choose a numeric attribute on the attribute chart. Then, a box will appear as displayed below:
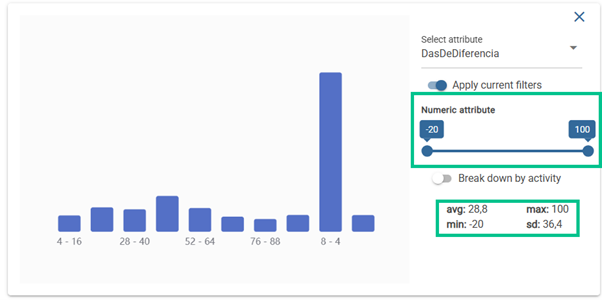
You will see a slider, with the minimum and maximum values of the chosen attribute. On the bottom of the box, the main statistic values of the numeric attributes (average, maximum, minimum and standard deviation). You can slide in order to change those values. When you do so, the graph will automatically update, along with the statistic values down (average, maximum, minimum and standard deviation).
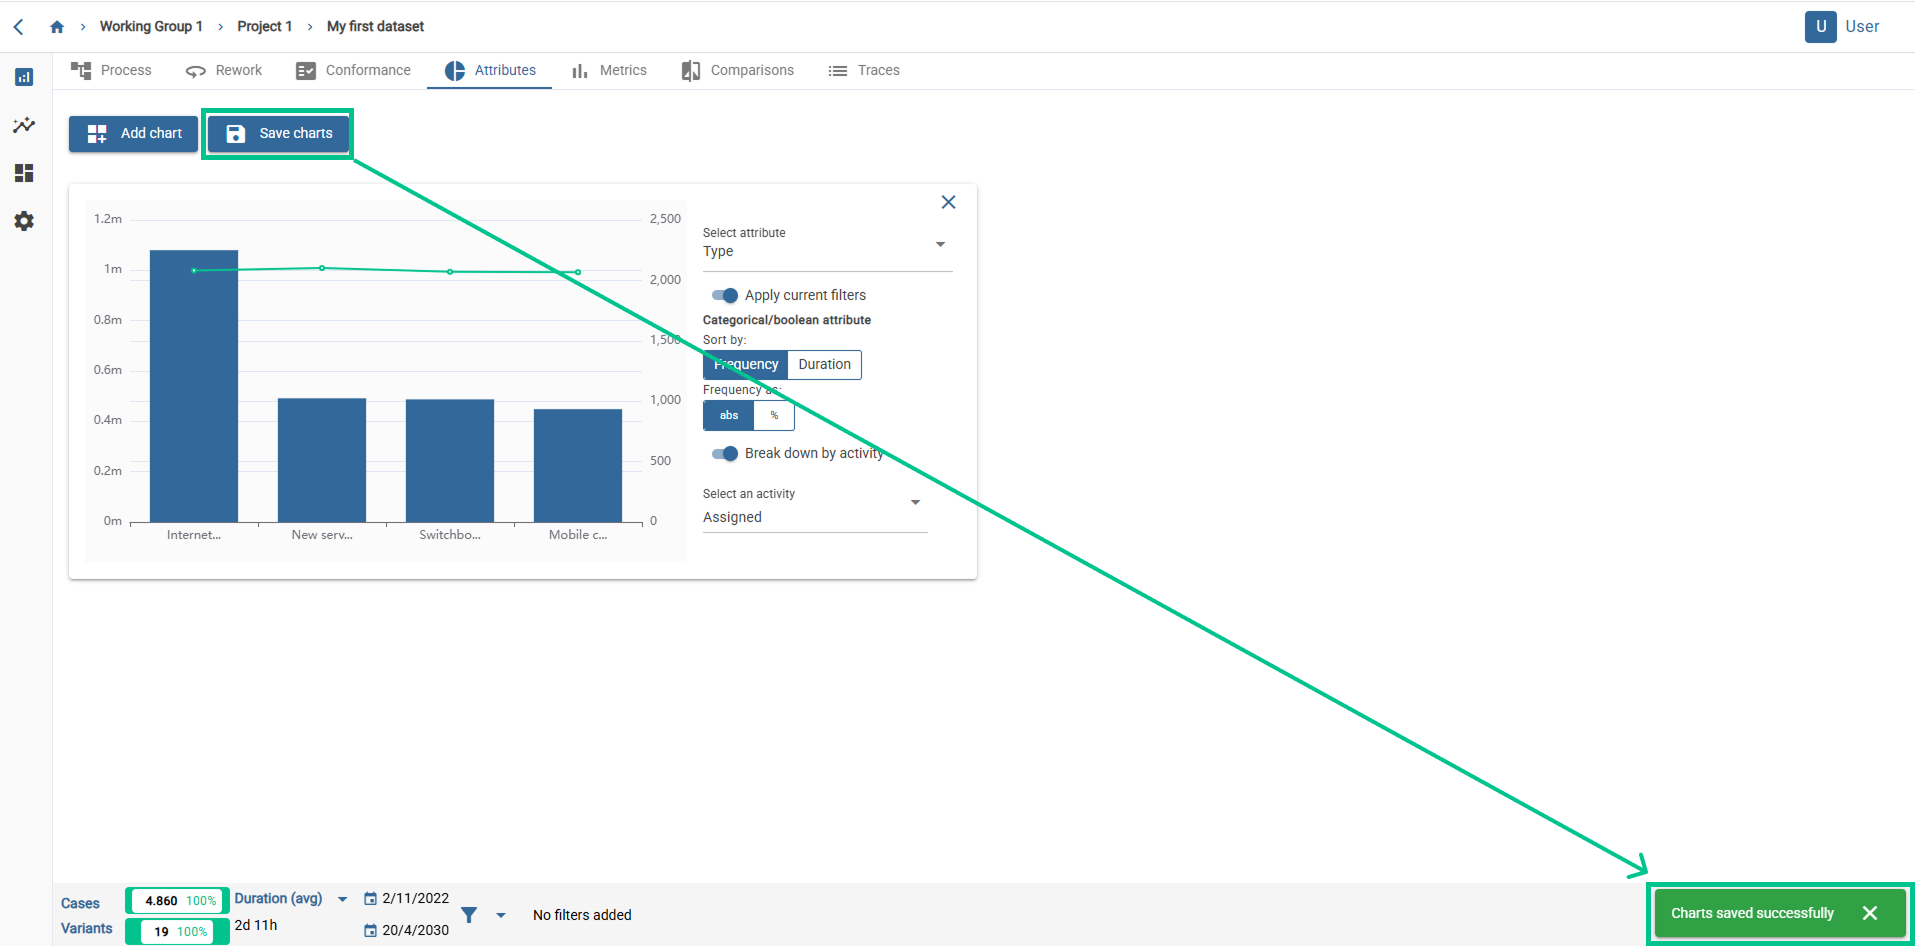
Once you have all the desired comparisons, you can save them by pressing the “Save charts” button. Then, the orange message disappears and a new green message (“Chart saved successfully”) appears. This way, when you re-open the dataset, the configured comparison will remain.